Jamaica Weather Explores Climate Zones Seasons Impacts
Table of Contents
- Climatic Zones and Microclimates of Jamaica
- Classification of Jamaica’s Climatic Zones
- Elevation and Microclimatic Variations
- Trade Winds and Coastal Climate Dynamics
- Oceanic Influences on Coastal Weather Extremes
- Seasonal Weather Patterns and Cyclone Activity in Jamaica
- Seasonal Temperature, Rainfall Trends, and Notable Weather Events
- Historical Frequency and Impact of Tropical Storms and Hurricanes
- Rainfall Distribution: North Coast vs. South Coast During Peak Cyclone Season
- El Niño/La Niña Phases and Their Influence on Jamaica’s Hurricane Risk and Rainfall
- Jamaica’s Meteorological Forecasting and Public Alert Systems
- Temperature and Humidity Extremes in Jamaica
- Monthly Temperature and Humidity Breakdown for Key Locations
- Physiological Effects of High Humidity on Tourism and Outdoor Labor
- Heatwaves and Their Economic Consequences
- Rainfall and Flooding Risks in Jamaica
- Geographical Distribution of Flood-Prone Regions
- Seasonal Rainfall Intensity and Flooding Patterns
- Impact of Flash Floods on Tourism and Infrastructure
- Flood Risk Data for High-Priority Regions
- Weather’s Impact on Tourism and Economy
- Sector-Specific Revenue and Operational Challenges
- Hurricane Disruptions and Economic Recovery
- Weather’s Role in Agricultural Export Fluctuations
- Economic Resilience: Coastal vs. Inland Tourism
- Weather-Informed Tourism Marketing by the Ministry of Tourism
Jamaica’s weather presents a dynamic interplay of tropical climates, seasonal extremes, and microclimatic variations that shape its economy, agriculture, and tourism. From the trade winds moderating coastal breezes to the Blue Mountains’ cooler highlands, the island’s diverse geography creates distinct weather patterns influencing everything from hurricane resilience to agricultural productivity. Understanding these factors is essential for stakeholders—whether planners, farmers, or travelers—to navigate challenges and capitalize on opportunities in one of the Caribbean’s most resilient climates.
The island’s climatic zones exhibit stark contrasts, where coastal regions like Negril experience steady humidity and sea breezes, while inland areas such as the Cockpit Country face erratic rainfall and higher temperature fluctuations. Seasonal shifts between dry and wet periods further amplify these disparities, with tropical storms and hurricanes posing intermittent yet significant disruptions. Meanwhile, urban heat islands in cities like Kingston intensify temperature extremes, while flood-prone regions demand proactive mitigation strategies. This exploration dissects Jamaica’s meteorological intricacies, offering data-driven insights into how weather influences daily life, economic sectors, and long-term sustainability.
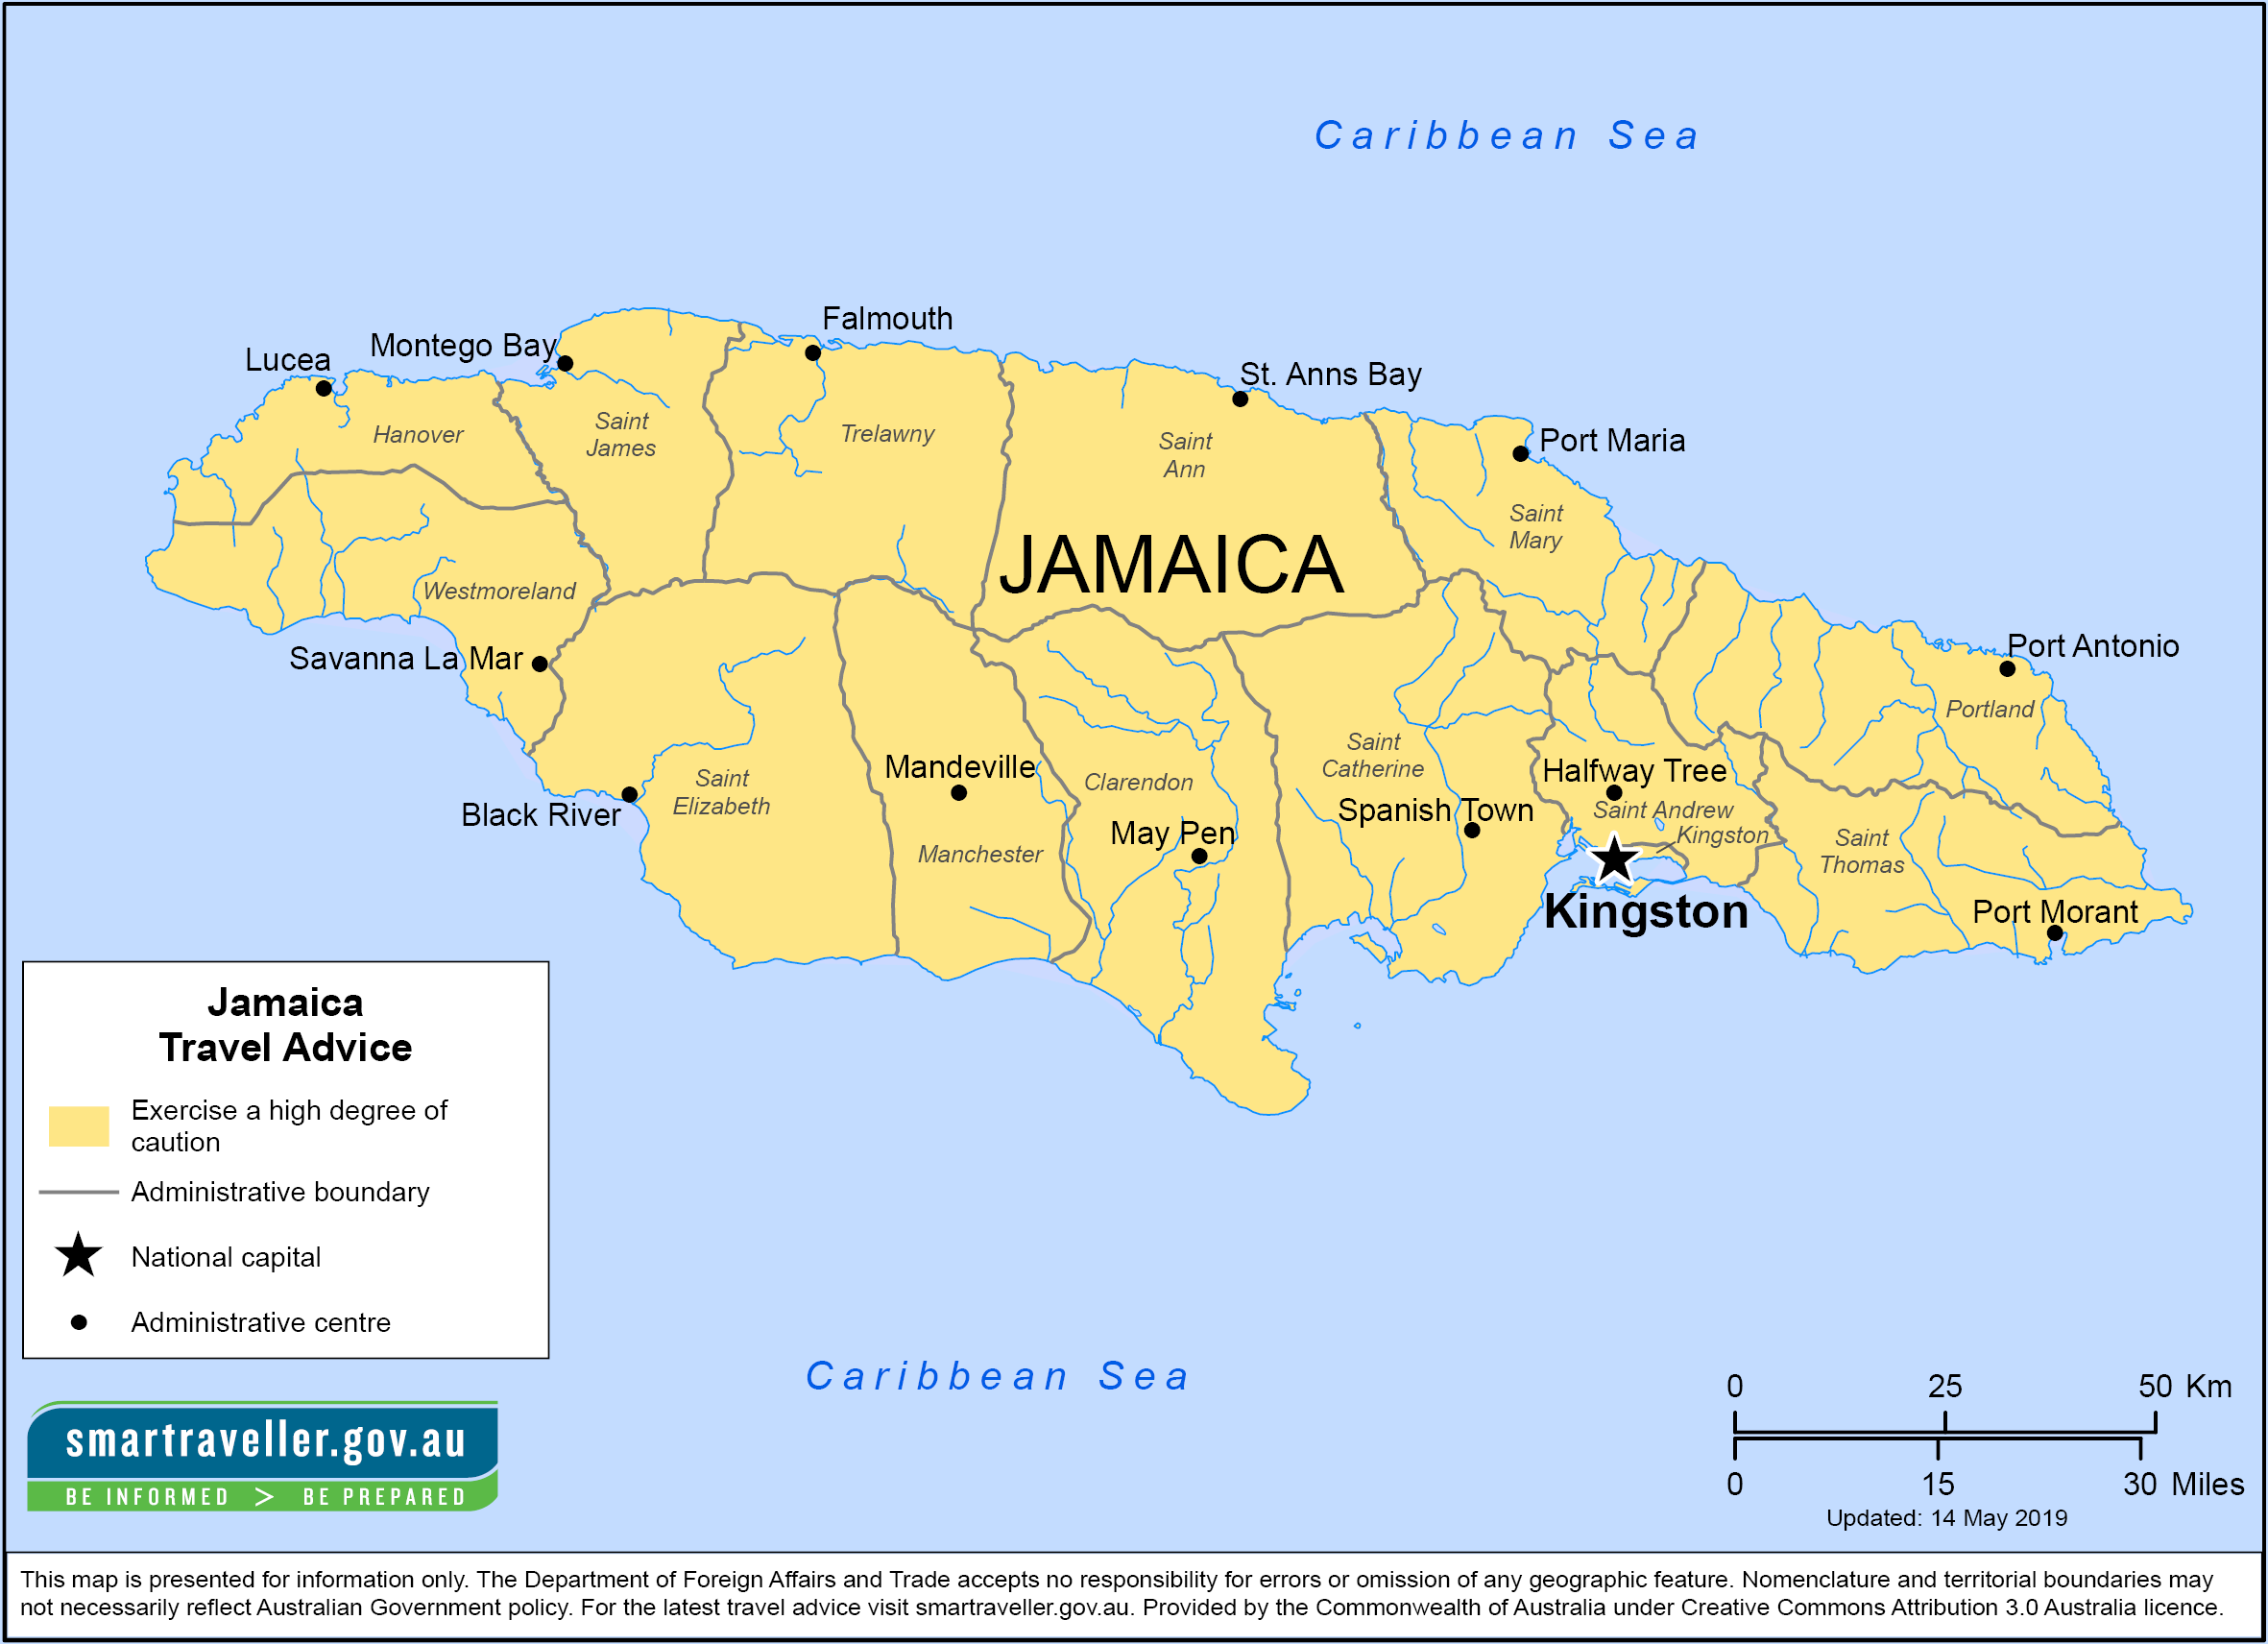
Climatic Zones and Microclimates of Jamaica
Jamaica’s diverse topography and geographical positioning create distinct climatic zones, each exhibiting unique temperature, humidity, and precipitation patterns. These variations arise from elevation, proximity to the coast, and the influence of ocean currents and trade winds. Understanding these zones—coastal, mountainous, and interior—reveals how microclimates shape regional weather dynamics, from the arid plains of the south to the perpetually misty peaks of the Blue Mountains.
The island’s climate is further moderated by the Caribbean Sea and Atlantic Ocean, which temper extreme temperatures and distribute moisture through trade wind patterns. Coastal areas experience distinct variations between the windward (east) and leeward (west) sides, while inland regions exhibit greater thermal and precipitation contrasts due to elevation. Below, the climatic characteristics of Jamaica’s primary zones are analyzed, alongside the role of elevation, trade winds, and oceanic influences in shaping local weather.
Classification of Jamaica’s Climatic Zones
Jamaica’s climate is categorized into four primary zones based on elevation, coastal exposure, and rainfall distribution: coastal lowlands, piedmont (foothill) regions, mountainous highlands, and interior valleys. Each zone exhibits distinct thermal and hydrological properties, influenced by altitude, distance from the sea, and orographic effects. The coastal lowlands, for instance, maintain higher humidity and consistent temperatures year-round, while the mountainous highlands experience cooler conditions and higher rainfall due to orographic lift.The following table summarizes the average annual temperature, rainfall, and humidity for each zone, derived from long-term meteorological data (1991–2020) from the Jamaica Meteorological Service and World Bank Climate Data.
| Zone | Avg. Temperature (°C) | Avg. Rainfall (mm) | Humidity (%) |
|---|---|---|---|
| Coastal Lowlands (e.g., Montego Bay, Negril) | 27–29 | 700–1,200 | 75–85 |
| Piedmont Regions (e.g., Spanish Town, Mandeville) | 24–26 | 1,000–1,500 | 70–80 |
| Mountainous Highlands (e.g., Blue Mountains, John Crow Mountains) | 18–22 | 2,000–3,500 | 80–90 |
| Interior Valleys (e.g., Trelawny Valley, Black River) | 25–27 | 500–1,000 | 65–75 |
Elevation and Microclimatic Variations
Elevation is the primary determinant of microclimates in Jamaica, creating stark contrasts between lowland and highland regions. Higher altitudes experience adiabatic cooling, where rising air expands and cools at a rate of approximately 6.5°C per 1,000 meters, leading to significantly lower temperatures and increased cloud cover. The Blue Mountains, Jamaica’s highest peak range (reaching 2,256 meters at Blue Mountain Peak), exemplify this effect, with temperatures averaging 18–22°C and near-constant mist or light rain due to orographic precipitation.In contrast, Luminous Springs in the parish of Manchester, situated at an elevation of 1,200 meters, maintains a cooler microclimate than surrounding lowlands but lacks the extreme precipitation of the Blue Mountains. The difference arises from local topography and wind patterns, where the Blue Mountains force moist trade winds upward, condensing into heavy rainfall, while Luminous Springs lies in a rain shadow relative to dominant wind directions.
Elevation in Jamaica dictates temperature gradients and precipitation distribution: every 1,000-meter increase in altitude reduces temperatures by 6–7°C and increases annual rainfall by 500–1,000 mm, primarily due to orographic lift and reduced evaporation rates at higher elevations.
Trade Winds and Coastal Climate Dynamics
Trade winds, predominantly easterly winds originating from the Northeast Trade Wind Belt, dominate Jamaica’s climate, particularly along the coast. These winds transport moisture from the Atlantic Ocean, resulting in higher rainfall on the windward (eastern) coast and drier conditions on the leeward (western) side. The effect is most pronounced in regions such as Ocho Rios (windward) and Negril (leeward), where precipitation and humidity levels differ significantly despite proximity to the sea.In Ocho Rios, located on the island’s northeast coast, trade winds ascend the John Crow Mountains, causing orographic precipitation with annual rainfall exceeding 1,500 mm. The region experiences consistent humidity (80–85%) and moderate temperatures (26–28°C), with a pronounced wet season from May to November. Conversely, Negril, on the western coast, lies in a rain shadow, receiving only 700–900 mm of rainfall annually and maintaining lower humidity (70–78%) due to the blocking effect of the Cockpit Country’s elevated terrain.
The trade winds also moderate coastal temperatures, preventing extreme heat in summer and cold snaps in winter. During the dry season (December–April), trade winds weaken slightly, reducing cloud cover and increasing daytime temperatures by 2–3°C in coastal areas like Montego Bay, where averages rise to 29–30°C.
Oceanic Influences on Coastal Weather Extremes
The Caribbean Sea and Atlantic Ocean play a critical role in stabilizing Jamaica’s coastal climate by absorbing and redistributing heat through ocean currents. The Gulf Stream and Caribbean Current transport warm water westward, influencing air temperatures and humidity along the island’s southern and western coasts. This moderation prevents extreme temperature fluctuations, ensuring that coastal regions like Port Antonio (east) and Black River (southwest) maintain relatively stable climates year-round.During the hurricane season (June–November), the Caribbean Sea’s warm surface waters (averaging 27–29°C) fuel tropical storm development, increasing the risk of intense rainfall and flooding in exposed coastal areas. For example, Kingston, situated on a narrow coastal plain, experiences flash flooding during heavy rainfall events due to poor drainage and the blocking effect of the Blue Mountains to the east, which funnels moisture toward the capital.
Conversely, the Atlantic Ocean’s cooler waters near the northeast coast contribute to lower humidity and reduced storm intensity in regions like Portland, where trade winds interact with the ocean’s temperature gradient. This interaction creates a microclimate buffer, reducing the frequency of severe weather compared to the more exposed southern coast.
The Loop Current, an extension of the Gulf Stream, occasionally brings warmer-than-average sea surface temperatures to Jamaica’s southwestern coast, increasing the likelihood of tropical depressions forming near Trelawny or St. Elizabeth. Historical data shows that years with elevated Loop Current activity, such as 2005 and 2017, correlate with higher-than-average hurricane landfalls in Jamaica, particularly affecting the south and west coasts.
Seasonal Weather Patterns and Cyclone Activity in Jamaica
Jamaica’s climate is governed by two distinct seasonal cycles—the dry season (December to April) and the wet season (May to November)—each characterized by variations in temperature, rainfall, and the heightened risk of tropical cyclones. The wet season coincides with the Atlantic hurricane season, during which Jamaica experiences increased precipitation, storm surges, and potential devastation from hurricanes. Understanding these patterns is critical for infrastructure resilience, agricultural planning, and public safety preparedness. Below, seasonal trends are quantified, historical cyclone impacts are analyzed, and regional rainfall disparities are examined, alongside the influence of El Niño/La Niña cycles and Jamaica’s meteorological forecasting mechanisms.Seasonal Temperature, Rainfall Trends, and Notable Weather Events
Jamaica’s seasonal weather patterns exhibit marked contrasts between the dry and wet seasons, with temperature and precipitation trends directly influencing tourism, agriculture, and disaster risk management. The following table summarizes average conditions and significant weather events during each period, derived from historical climate data (1991–2020) and National Meteorological Service (JMS) records.| Season | Avg. Temperature (°C) | Rainfall Trends | Notable Weather Events |
|---|---|---|---|
| Dry Season (Dec–Apr) | 24–28°C (cooler mornings, warmer afternoons) | Lowest rainfall (≤50mm/month); northeast trade winds dominate, reducing humidity. | 2015–2016: Prolonged drought in southern parishes (e.g., St. Thomas) led to water restrictions. |
| Coastal areas (e.g., Montego Bay) experience higher evaporation rates, increasing wildfire risk. | 2019: Heatwave peaks at 32°C in Kingston, exacerbating air quality issues. | ||
| Wet Season (May–Nov) | 26–30°C (higher humidity, frequent afternoon showers) | Peak rainfall (150–300mm/month); June–October sees highest cyclone activity. | 2004: Hurricane Ivan (Cat. 5) caused $3.5B in damages, including 17 deaths and widespread flooding. |
| September–October: "Hurricane Season" with 70% of annual rainfall; mountainous regions (e.g., Blue Mountains) receive >400mm. | 2017: Hurricane Irma (Cat. 5) triggered landslides in St. Andrew, disrupting road networks. |
Historical Frequency and Impact of Tropical Storms and Hurricanes
Jamaica lies within the Atlantic hurricane belt, making it vulnerable to tropical storms and hurricanes, which typically form between June and November. Since 1950, Jamaica has experienced 34 direct hurricane hits, with catastrophic events occurring approximately every 10–15 years. The most devastating storms include:Post-Ivan, Jamaica implemented the National Disaster Preparedness Agency (NDPA) to standardize emergency response protocols, including mandatory evacuation drills in high-risk zones like the south coast (e.g., Black River).
Rainfall Distribution: North Coast vs. South Coast During Peak Cyclone Season
Jamaica’s rainfall patterns during the hurricane season (September–October) exhibit significant regional disparities due to orographic lift and wind direction. The north coast, facing the Atlantic, receives 60–80% more precipitation than the south coast during peak cyclone activity, primarily due to:Case Study: Hurricane Dean (2007)
This disparity underscores the need for region-specific flood mitigation strategies, such as the North Coast Drainage Project (2010–2015) and south-coastal seawall reinforcements.
El Niño/La Niña Phases and Their Influence on Jamaica’s Hurricane Risk and Rainfall
El Niño-Southern Oscillation (ENSO) phases exert a profound influence on Jamaica’s climate, modulating hurricane frequency and rainfall distribution through atmospheric teleconnections. The following mechanisms explain their impact:- El Niño Years (e.g., 2015–2016, 2009–2010):
Jamaica’s Meteorological Forecasting and Public Alert Systems
Jamaica’s National Meteorological Service (JMS), in collaboration with the
Temperature and Humidity Extremes in Jamaica
Jamaica’s tropical climate is characterized by consistent warmth year-round, but temperature and humidity extremes vary significantly across regions, seasons, and microclimates. While coastal areas experience moderate fluctuations, inland highlands and urban centers exhibit pronounced variations, influenced by elevation, proximity to the Caribbean Sea, and anthropogenic factors. These extremes impact human physiology, agricultural productivity, energy consumption, and tourism infrastructure, necessitating adaptive strategies for resilience.The interplay between high humidity and elevated temperatures creates physiological stress, particularly during peak summer months, while rare cold snaps in highland regions underscore the island’s climatic diversity. Urban heat islands further exacerbate temperature extremes, demanding specialized planning for public health and economic stability.
Monthly Temperature and Humidity Breakdown for Key Locations
Jamaica’s temperature and humidity patterns exhibit spatial and temporal variability, with coastal cities like Kingston and Montego Bay maintaining relatively stable conditions, while Spanish Town—situated at a higher elevation—experiences greater diurnal and seasonal contrasts. The following table summarizes average maximum and minimum temperatures (°C) alongside mean humidity (%) for Kingston (coastal), Montego Bay (tourist hub), and Spanish Town (inland highland) based on long-term climatological data (1991–2020).| Month | Kingston (Max °C / Min °C / Humidity %) |
Montego Bay (Max °C / Min °C / Humidity %) |
Spanish Town (Max °C / Min °C / Humidity %) |
|---|---|---|---|
| January | 29 / 22 / 78% | 28 / 21 / 76% | 27 / 18 / 80% |
| February | 29 / 22 / 77% | 28 / 21 / 75% | 27 / 18 / 79% |
| March | 30 / 22 / 76% | 29 / 21 / 74% | 28 / 18 / 78% |
| April | 31 / 23 / 75% | 30 / 22 / 73% | 29 / 19 / 77% |
| May | 32 / 24 / 74% | 31 / 23 / 72% | 30 / 20 / 76% |
| June | 32 / 24 / 75% | 31 / 23 / 73% | 30 / 20 / 77% |
| July | 33 / 25 / 76% | 32 / 24 / 74% | 31 / 21 / 78% |
| August | 33 / 25 / 77% | 32 / 24 / 75% | 31 / 21 / 79% |
| September | 32 / 24 / 78% | 31 / 23 / 76% | 30 / 20 / 80% |
| October | 31 / 23 / 79% | 30 / 22 / 77% | 29 / 19 / 81% |
| November | 30 / 22 / 78% | 29 / 21 / 76% | 28 / 18 / 80% |
| December | 29 / 22 / 77% | 28 / 21 / 75% | 27 / 18 / 79% |
Physiological Effects of High Humidity on Tourism and Outdoor Labor
Jamaica’s tropical climate combines high temperatures with relative humidity often exceeding 70%, creating a heat index—a measure of perceived temperature—that can surpass 45°C in July and August. This combination imposes significant physiological strain on tourists and outdoor workers, influencing productivity, health risks, and economic outcomes.Tourism Impact:
Outdoor Labor Challenges:
Adaptive Measures:
Heatwaves and Their Economic Consequences
While Jamaica’s climate is stable, periodic heatwaves—defined as three consecutive days with temperatures ≥35°C and humidity ≥75%—disrupt agriculture, energy systems, and public health. Notable events include the 2015 Caribbean Heatwave, which affected Jamaica’s banana and coffee sectors, and the 2020–2021 drought-induced heat stress, exacerbating energy demand.Agricultural Impacts:
Rainfall and Flooding Risks in Jamaica
Jamaica’s rainfall patterns exhibit significant spatial and temporal variability, influenced by orographic effects, seasonal wind shifts, and anthropogenic land-use changes. While the island’s mountainous terrain enhances precipitation in windward regions, low-lying coastal areas and river valleys are particularly vulnerable to flash flooding. Understanding these dynamics is critical for infrastructure planning, disaster preparedness, and sustainable tourism development, as extreme rainfall events disproportionately affect vulnerable communities and high-traffic zones.The interplay between geological features, deforestation, and seasonal rainfall peaks creates distinct flood risks across Jamaica. High-intensity rainfall during the "May Day" season (late April–early June) and the late-summer peak (September–October) triggers localized flooding, with the latter often linked to tropical cyclone remnants. Flash floods in iconic locations such as YS Falls and the Black River Basin disrupt tourism operations, damage roads, and strain drainage systems, underscoring the need for targeted mitigation strategies.
Geographical Distribution of Flood-Prone Regions
Jamaica’s flood risks are concentrated in regions characterized by steep topography, narrow river valleys, and high rainfall gradients. The following areas exhibit recurring flooding due to a combination of geological vulnerabilities and land-use pressures:Key flood-prone zones and their geological causes:The Jamaican Meteorological Service (JMS) identifies these zones as high-risk based on historical flood events, with St. Thomas and St. Andrew experiencing the most frequent disruptions to transportation and agriculture.
St. Thomas (Blue Mountains): Steep slopes and rapid river discharge (e.g., Rio Grande) exacerbate flash flooding during heavy rainfall. St. Andrew (Liguanea Plain): Urban expansion and poor drainage infrastructure increase surface runoff, overwhelming drainage systems. Trelawny (Magdalene River Basin): Deforestation and agricultural runoff heighten sediment load, reducing river capacity. Westmoreland (YS Falls): Karst limestone terrain limits groundwater absorption, leading to rapid surface flooding. St. Elizabeth (Black River): Sediment accumulation from upstream erosion narrows river channels, increasing flood risk during peak rainfall.
Seasonal Rainfall Intensity and Flooding Patterns
Jamaica’s rainfall exhibits two primary peaks, each associated with distinct meteorological drivers and flooding impacts. The "May Day" season (late April–early June) is marked by intermittent but intense convective storms, while the late-summer peak (September–October) aligns with the North Atlantic hurricane season, often amplifying flood risks due to tropical moisture influx.Rainfall intensity comparison:The late-summer peak poses a higher threat to life and property due to the cumulative effect of prolonged rainfall, whereas May Day floods are more abrupt but equally disruptive to tourism-dependent regions.
May Day Season (Late April–Early June): Average monthly rainfall: 150–250 mm (varies by elevation). Flooding mechanism: Short-duration, high-intensity thunderstorms over mountainous regions. Impact: Localized flash floods in river valleys (e.g., Martha Brae, St. Thomas). Example: The 2018 St. Thomas floods submerged roads and damaged crops within hours of a single storm event. - Late-Summer Peak (September–October):
Average monthly rainfall: 200–400 mm, with extreme events exceeding 500 mm during tropical cyclone remnants. Flooding mechanism: Prolonged rainfall from tropical waves or hurricanes, combined with saturated soil. Impact: Widespread riverine flooding (e.g., Black River, Rio Cobre) and urban flooding in low-lying areas (e.g., Kingston’s Southside). Example: Hurricane Ivan (2004) triggered catastrophic flooding in Westmoreland, destroying bridges and isolating communities for weeks.
Impact of Flash Floods on Tourism and Infrastructure
Flash floods in Jamaica’s natural attractions and transportation corridors create significant economic and operational challenges. High-traffic areas such as YS Falls (Trelawny) and the Black River Basin (St. Elizabeth) experience repeated disruptions, affecting visitor safety and local livelihoods.Critical tourism and infrastructure hotspots:These events highlight the need for real-time monitoring and adaptive infrastructure, particularly in regions reliant on tourism revenue.
YS Falls (Trelawny): Flooding mechanism: Rapid runoff from surrounding limestone hills during thunderstorms. Impact: Road closures (e.g., YS Falls Road) stranding tourists and limiting access to the falls. Case study: In 2020, flash floods submerged the parking area, forcing temporary closures for two weeks. - Black River Basin (St. Elizabeth):
Flooding mechanism: Sediment-laden river overflow during tropical waves, combined with tidal surges. Impact: Damage to the Black River Bridge (a key transport link) and erosion of riverbanks, threatening mangrove ecosystems. Case study: The 2017 floods washed out sections of the bridge, requiring a $12 million repair project funded by the government. - Kingston’s Southside (St. Andrew):
Flooding mechanism: Poor drainage in urbanized areas, exacerbated by deforestation in the Blue Mountains. Impact: Submerged roads (e.g., Half-Way Tree Road) and power outages, disrupting commutes and businesses. Case study: The 2019 "May Day" floods paralyzed traffic for three days, costing an estimated $5 million in lost productivity.
Flood Risk Data for High-Priority Regions
The following table summarizes flood risk metrics for Jamaica’s most vulnerable regions, including average annual rainfall, recent flood events, and mitigation strategies implemented by local authorities.| Region | Avg. Annual Rainfall (mm) | Flood Events (Last 10 Years) | Mitigation Measures | |||||||||||||||||||
|---|---|---|---|---|---|---|---|---|---|---|---|---|---|---|---|---|---|---|---|---|---|---|
| St. Thomas (Blue Mountains) | 3,000–4,000 |
|
|
|||||||||||||||||||
| St. Andrew (Liguanea Plain) | 1,200–1,500 |
|
|
|||||||||||||||||||
| Trelawny (YS Falls) | 1,800–2,200 |
|
|
|||||||||||||||||||
| St. Elizabeth (Black River) | 1,000–1,300 |
Weather’s Impact on Tourism and EconomyJamaica’s tourism and agricultural sectors are highly sensitive to climatic conditions, with weather patterns directly influencing revenue streams, operational challenges, and long-term economic stability. Coastal destinations rely on stable weather for beach tourism, while adventure and eco-tourism sectors face disruptions from extreme rainfall or hurricane activity. Similarly, agricultural exports such as Blue Mountain coffee and allspice are vulnerable to temperature fluctuations, droughts, and excessive humidity, leading to market volatility. This section examines the sector-specific impacts of weather, supported by empirical data from past disruptions and adaptive strategies employed by government and private entities.Sector-Specific Revenue and Operational ChallengesWeather variability creates distinct challenges across Jamaica’s tourism and agricultural sectors, with coastal and inland regions experiencing divergent economic effects. Below is an analysis of key sectors, their peak weather seasons, revenue impacts, and operational hurdles.
Hurricane Disruptions and Economic RecoveryHurricanes and tropical storms represent the most severe weather-related threats to Jamaica’s tourism economy, with direct and indirect costs extending beyond immediate property damage. Hurricane Gustav (2008), for example, forced the closure of resorts in Montego Bay and Negril, reducing hotel occupancy by 40–50% in the affected regions for up to three months post-storm. According to the Jamaica Tourist Board, the 2008 hurricane season cost the tourism sector an estimated $120 million USD in lost revenue, with recovery taking 6–9 months due to delayed international flights and canceled cruise ship arrivals.Data Highlights: The Ministry of Tourism later implemented a "Weather-Resilient Tourism" initiative, partnering with insurers to offer hurricane-proofing grants for resorts and developing real-time weather alert systems to notify travelers of disruptions. Weather’s Role in Agricultural Export FluctuationsJamaica’s agricultural sector, particularly Blue Mountain coffee and allspice, is highly dependent on precise climatic conditions. Temperature anomalies, erratic rainfall, and humidity levels directly affect crop yields and quality, influencing global market prices. Below are the key weather-related risks and their economic consequences:- Blue Mountain Coffee: - Allspice (Pimento): Market Response: Economic Resilience: Coastal vs. Inland TourismThe economic resilience of Jamaica’s tourism sectors varies significantly based on geographic exposure to weather extremes. Coastal destinations, while generating higher revenue, are more vulnerable to hurricanes and storm surges, whereas inland eco-tourism relies on stable microclimates but faces localized flooding and accessibility issues."Coastal tourism in Ocho Rios thrives on predictable dry-season conditions, with resorts achieving 80–90% occupancy during peak months. However, a single Category 3 hurricane can erase six months of revenue, as seen with Hurricane Dean (2007), which caused $150 million USD in damages and a 25% drop in cruise ship visits. In contrast, the Cockpit Country’s eco-tourism—centered on cave exploration and birdwatching—experiences minimal hurricane impact but suffers from seasonal river flooding, which limits access to key sites like Rio Grande. While coastal areas recover faster through international marketing, inland tourism depends on community-led resilience strategies, such as diversifying attractions (e.g., cultural festivals) to offset weather-related closures."Resilience Strategies: - Inland/Eco-Tourism: Weather-Informed Tourism Marketing by the Ministry of TourismThe Jamaica Ministry of Tourism leverages meteorological data to optimize promotional campaigns, ensuring alignment with seasonal weather trends. By analyzing historical climate patterns and real-time forecasts from the Meteorological Service of Jamaica, the ministry tailors messaging to minimize weather-related risks and maximize visitor confidence.Key Strategies Jamaica’s weather is more than a backdrop to island life—it is a defining force shaping resilience, innovation, and adaptation across its sectors. The interplay of elevation, ocean currents, and seasonal cycles creates a climate system that demands both scientific foresight and community preparedness. From the agricultural heartlands of the Blue Mountains to the tourism-dependent coastlines of Montego Bay, stakeholders must leverage meteorological data to mitigate risks while harnessing opportunities. As climate patterns evolve, Jamaica’s ability to integrate forecasting, infrastructure planning, and economic strategies will determine its capacity to thrive in an ever-changing environment. This analysis underscores the urgency of informed decision-making, where weather is not merely a variable but a strategic asset in the island’s sustainable future. |
Leave a Comment
Comments are moderated before appearing. The data you submit is processed according to the Privacy Policy of Ns2.